KIAMIS dashboards put Nandi’s 168,894 farm households on a live map
Key points
- KIAMIS National Agricultural Dashboards list 168,894 farming households across Nandi’s six sub-counties and 30 wards.
- Gender split among recorded farmers: about 106,036 men and 60,788 women; roughly 135,500 people in farming groups/cooperatives.
- Crop side: 137,692 registered crop farmers; 127,762 households using certified seeds; 313,366 acres under cultivation led by maize.
- Livestock: 95,501 farmers managing about 1.13 million animals; nearly 99% of farms remain rain-fed.
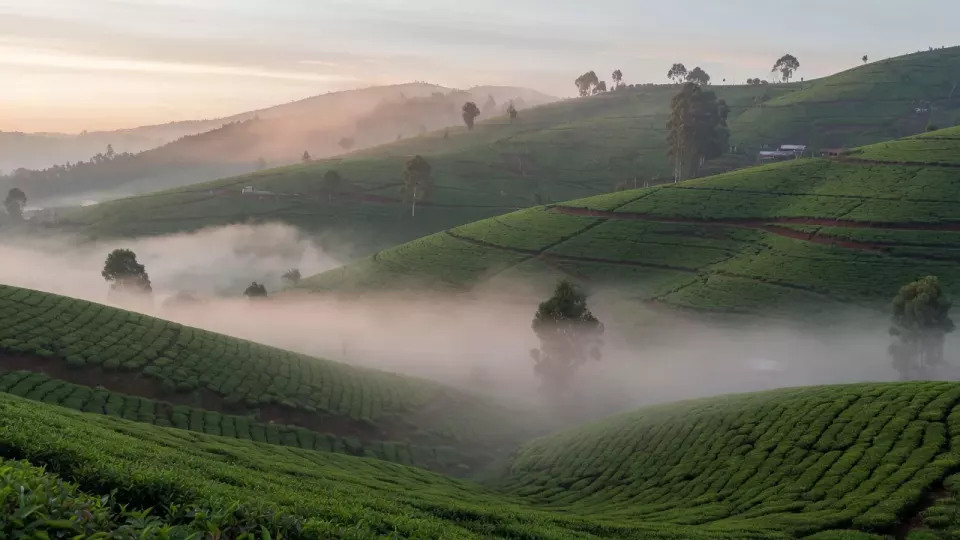
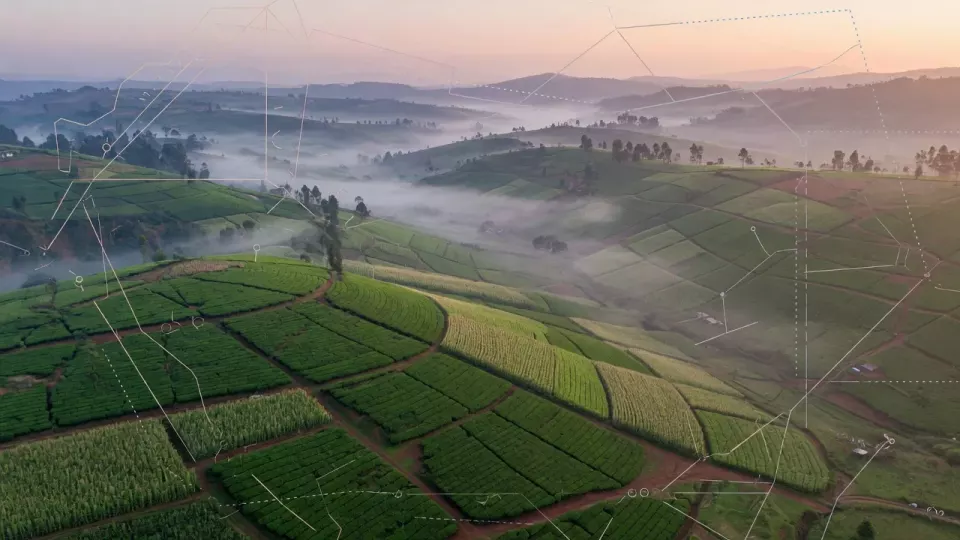
In Nandi’s tea-green highlands, agricultural planning is no longer supposed to run on dusty paper registers and best guesses. Through the Kenya Integrated Agricultural Management Information System (KIAMIS) and its National Agricultural Dashboards, county farmers are logged as live data points that planners can query ward by ward, KBC reported in an analysis co-bylined for the platform’s Nandi rollout.
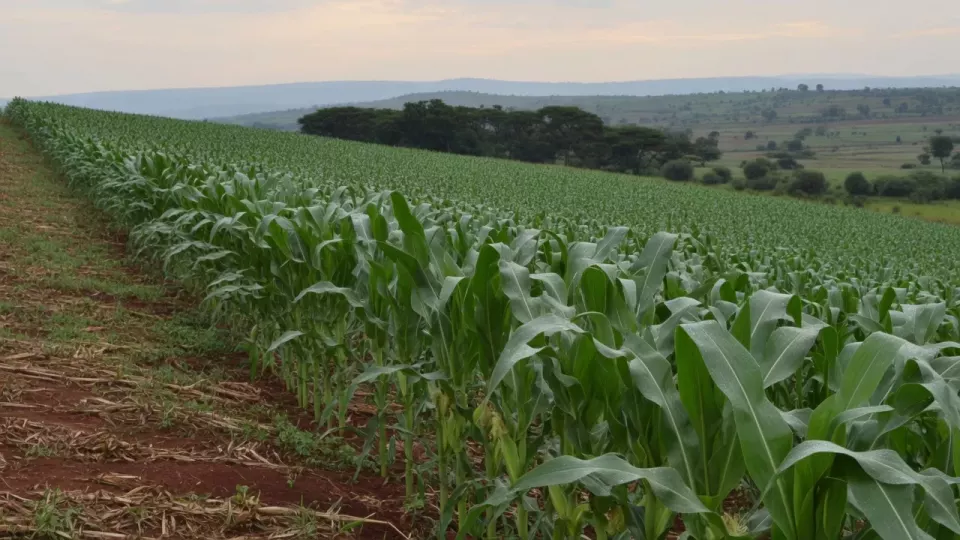
Log into the dashboard and the county unfolds across six sub-counties and thirty wards, home to 168,894 farming households — recorded as 106,036 men and 60,788 women, with about 135,500 individuals listed in farming groups and cooperatives. Of 137,692 registered crop farmers, 127,762 households now use certified seeds, a shift the authors flag as consequential for yields. Maize dominates 313,366 acres under cultivation, trailed by beans, tea and bananas. Purpose split: 78,071 households farm for both subsistence and commerce, 71,214 purely for food, and 48,661 commercially.
Livestock maps, gender gaps and water risk
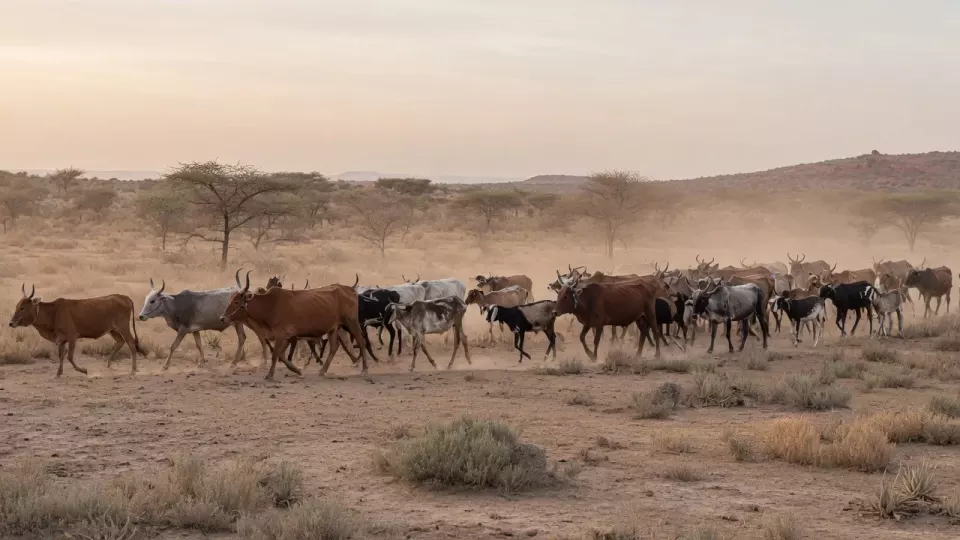
The livestock panel counts 95,501 livestock farmers managing 1,125,923 animals across 68 value chains, with cattle at 269,236 head still dominant and free-range grazing still leading production systems. Two structural warnings stand out. First, the gender gap: men outnumber women farmers roughly two to one (about 64% to 36%) in both crops and livestock — a signal for gender-and-social-inclusion design in extension and credit. Second, water: an overwhelming 99 per cent of Nandi farms are rain-fed, with irrigation reaching barely 900 farms out of more than 137,000 crop farms — a single statistic that sketches future irrigation investment if rainfall keeps shifting.
Authors argue dashboards let county agriculture offices answer precise questions — which wards need certified-seed subsidies, where the next irrigation scheme should sit, which sub-counties show the widest livestock gender gap — so budgets and donor proposals rest on live numbers rather than an outdated census. They also stress limits: dashboards do not plant seeds or dig boreholes; they make households “visible, countable, and plannable.” Readers were pointed to the Kaimosi Agricultural Research and Training Centre expo (theme on innovative technologies and value addition). Agriculture desk: Agriculture. Verified dashboard figures above from the KBC package; data quality still depends on field registration completeness and update cadence.
Based on KBC reporting of KIAMIS/National Agricultural Dashboards figures for Nandi County. Official dashboard releases and county agriculture reports control the latest counts.